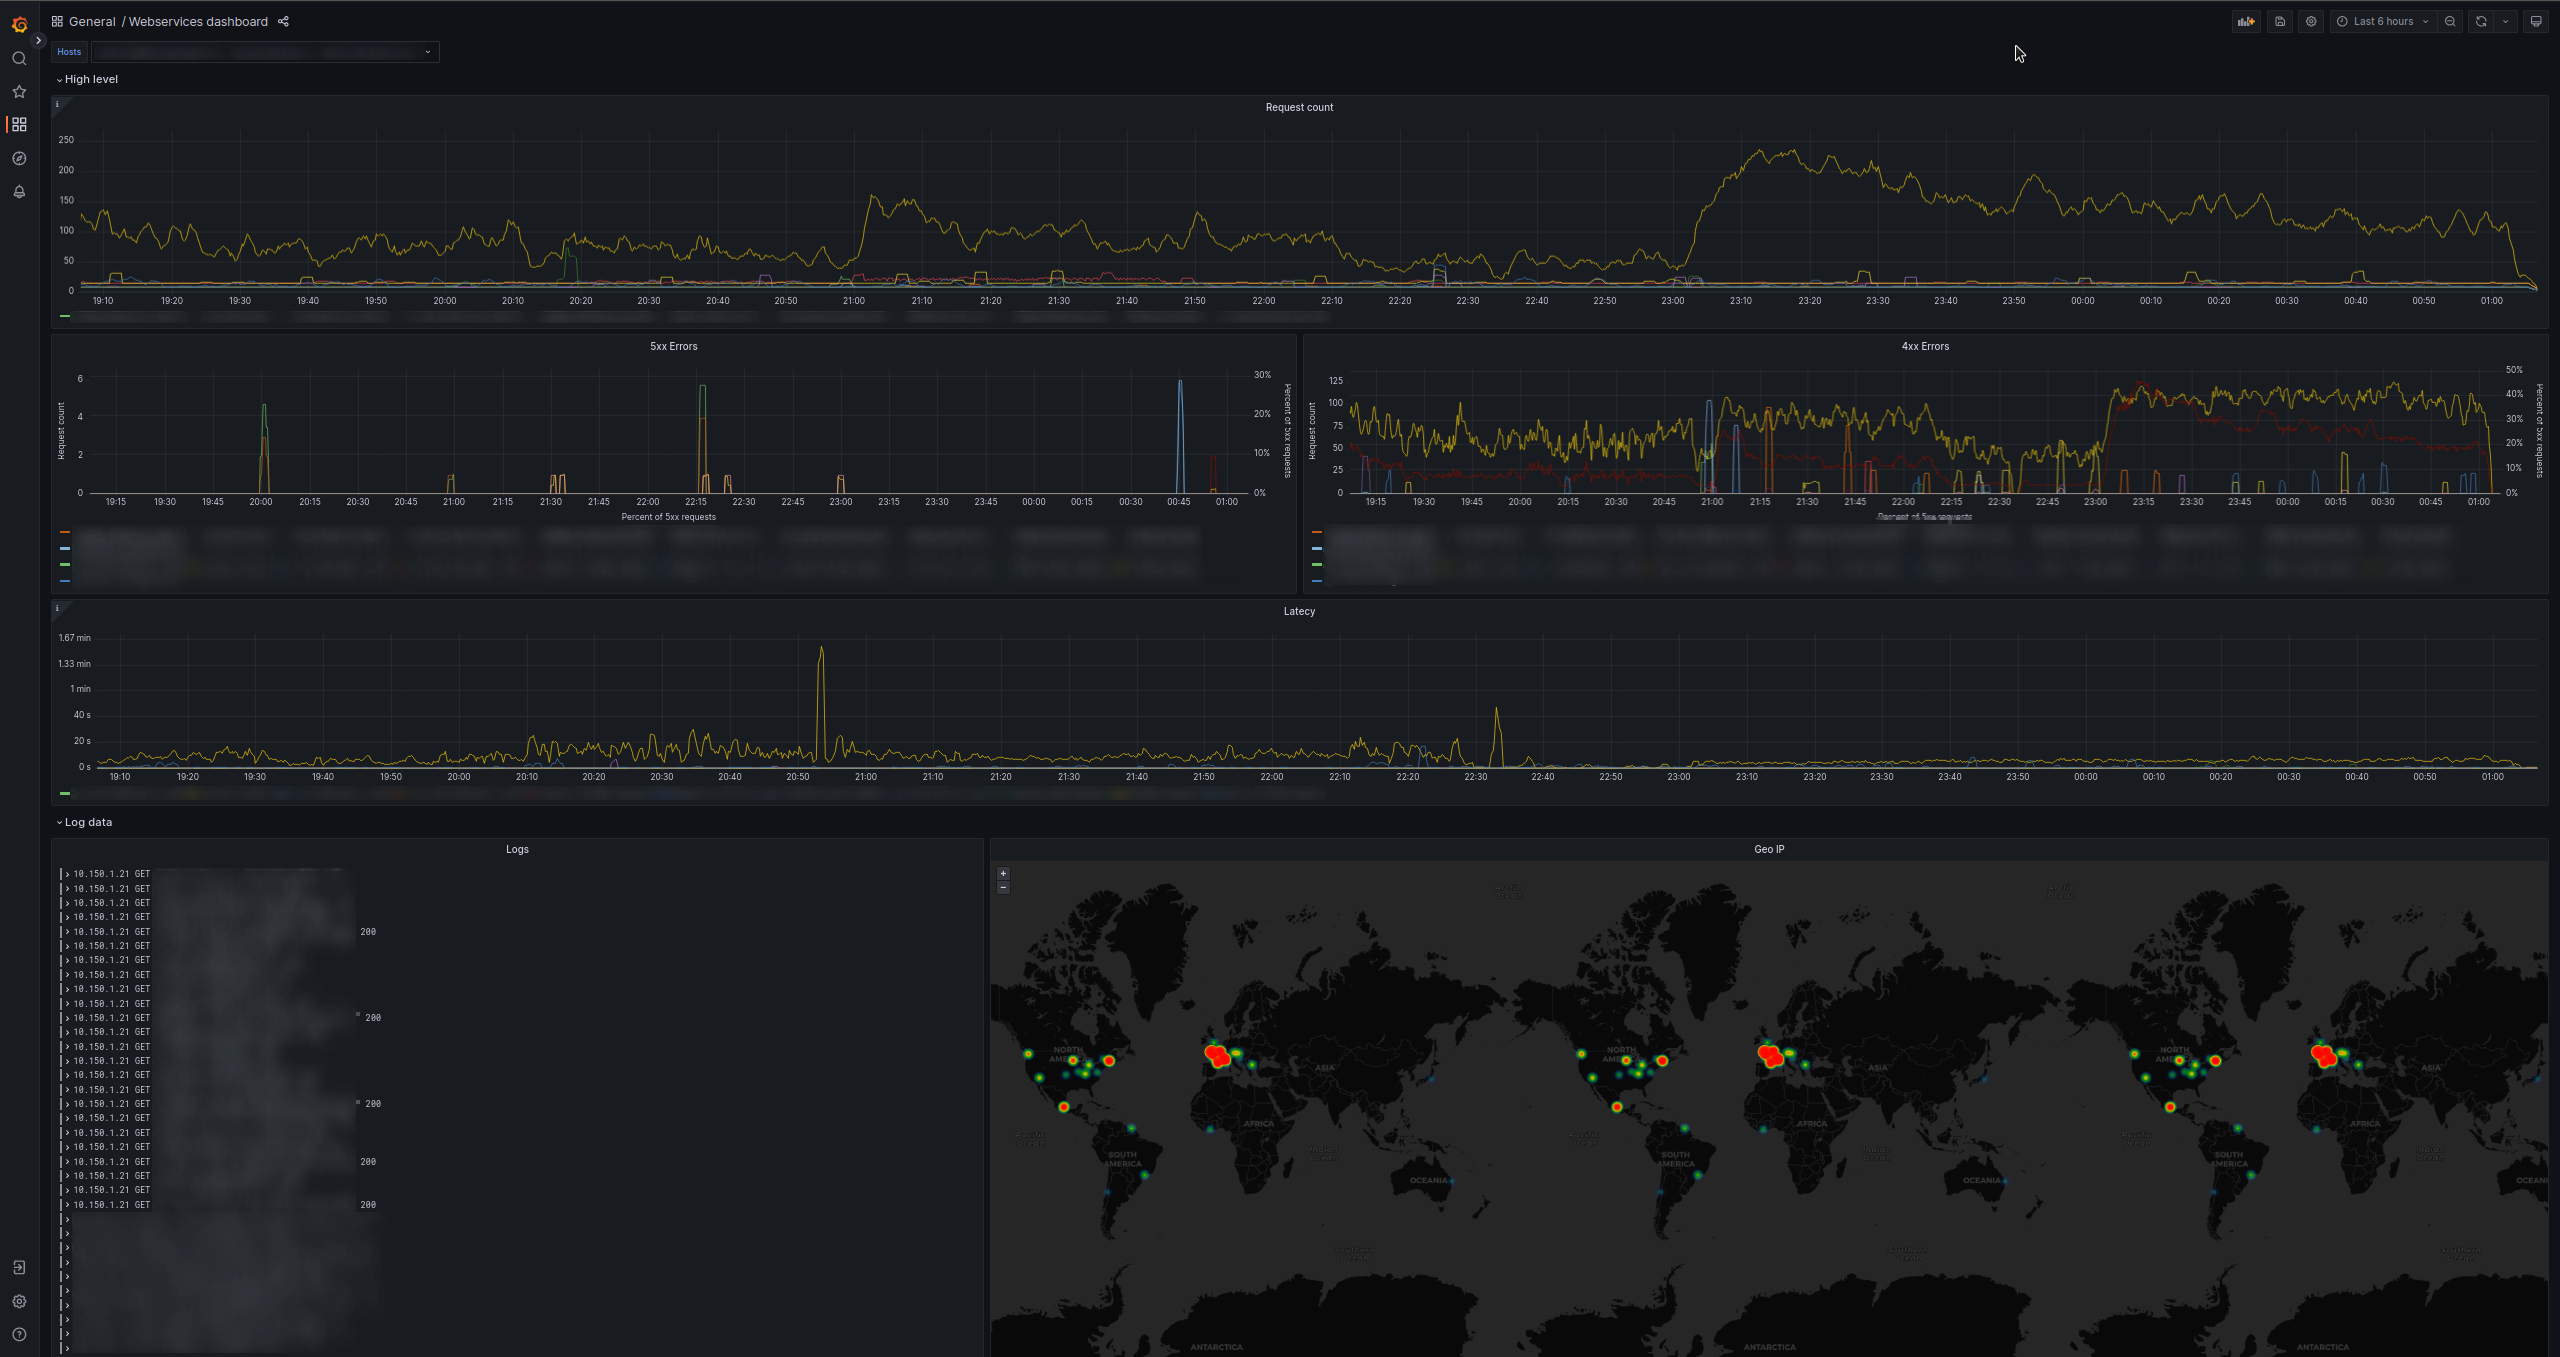
Everybody loves fancy graphs
As an observability geek, I like collecting data to display it on fancy, useless graphs in my dashboard (possibly positioned below the useful ones).
I tend to use Prometheus and Grafana Loki in my setups, to collect respectively metrics and logs.
I like those two specifically because those are lightweight and powerful solutions.
Unfortunately what’s trivial with logging/observability solutions like ELK (Elasticsearch, Logstash and Kibana, a chunky stack), can result in quite a bit of complexity in other platforms, like Prometheus and [Grafana] Loki. That’s the case with a GeoMap
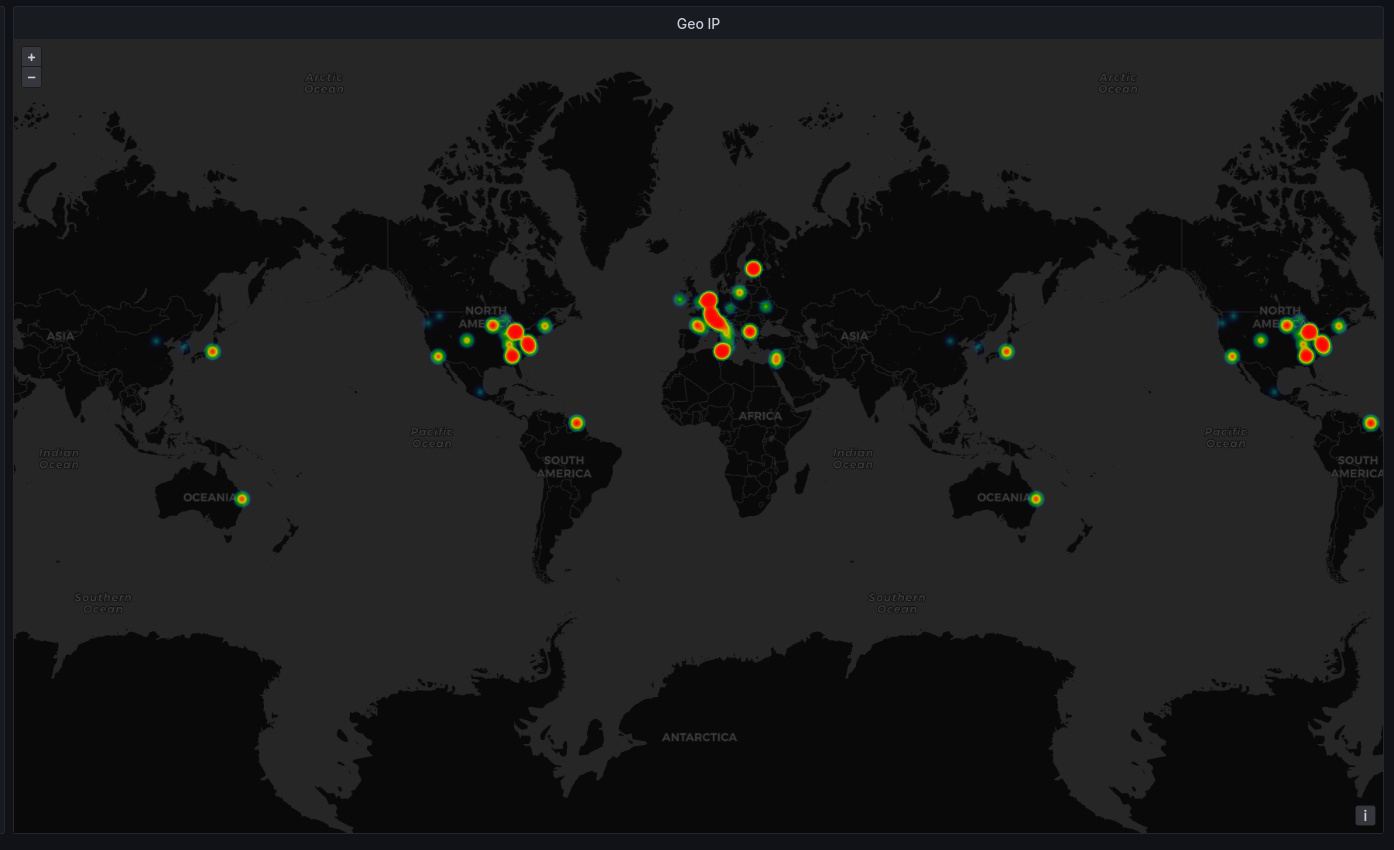
One way to visualize the IPs (and their approximate location) is through an interactive map with a heatmap overlay, showing the visitor density in different regions of the map (look above!).
As mentioned, though, I discovered that setting up this small, colored window was harder than expected.
How to
In this blog post, I’ll walk through the steps of setting up an interactive, geographic heatmap on Grafana, with the data:
- being provided from an Nginx web server
- enriched and sent to Grafana Loki using Vector.dev
- shown on Grafana
By the end of this post, you will be able to have your own heatmap in your Grafana instance: let’s start!
Requirements
There are some thing I’m not going to explain in this post, such as:
- How to setup Grafana Loki
- How to setup Grafana
- How to setup a web server (or the source of IP addresses you want to put in a map)
My setup
I tend to use docker in my setups.
Both the NGINX instance and the Vector.dev instances will be running in docker.
Deployment of Grafana, Loki & other stuff is out of scope.
Grafana
Grafana is a super cool piece of software used to create and consult dashboards based on data!
Grafana Loki
Loki (not the Norse god), is a great piece of software heavily inspired by Prometheus but focused on collecting logs rather than metrics data.
It is supposed to be lightweight, both on the compute resources and on the storage side.
This is not a post on Loki, but if you’re not familiar with it I suggest you to give it a try!
NGINX
NGINX is a popular webserver. You hopefully have heard of it.
I started using it many years ago and I like it so far, it’s lightweight and it does its job (mostly).
The webserver I use is NGINX with some custom configurations.
Vector.dev
Vector is a nice (when properly documented, that’s the reason for this post) piece of software used to perform transformation and enrichment of data (like logs).
You can use it to filter your logs, enrich them, delete fields and more!
I started using it as an alternative to Fluentd and Fluentbit and happened to like it very much.
The juice
The MaxMind database
You’ll need a database to map an IP address to its coordinates.
At the time of writing, you need to use the MaxMind one (no worries, that’s free at the time of writing).
Unfortunately, the database is behind an authwall, so you need to register to the MaxMind website here.
Once you signed up, head to the downloads page and download the GeoLite2 City on your server, to unzip the GeoLite2-City.mmdb in the path you prefer the most.
Keep in mind that Vector will need to have access to the DB.
Vector setup
This is my vector.toml (I know, toml…) config:
[enrichment_tables.gip]
# Here we specify where our database is
type = "geoip"
path = "/etc/vector/ipdb.mmdb"

[api]
enabled = false
address = "0.0.0.0:8686"

[sources.nginx_logs_raw]
type = "file"
# We tell Vector where our nginx log files are
include = ["/var/log/nginx/*.log"]
read_from = "end"

# Then we enrich the logs with a remap transformation
[transforms.nginx_logs]
type = "remap"
inputs = ["nginx_logs_raw"]

# If you're not using my config but just the standard one, just use `structured, err = parse_nginx_log(.message, "error")`

source = """
structured, err =  parse_regex(.message, r'(?P<client>[0-9a-f.:]+) - (?P<user>[^\\[]+) \\[(?P<time>[0-9A-Za-z:./+ -]+)\\]  (?P<status>[0-9]+) "((?P<method>[A-Z]+) (?P<path>.+) HTTP/(?P<version>[0-3.]{3})|(?P<uncorret_req>.*))" (?P<body_size>[0-9]+) "(?P<refer>.+)" "(?P<user_agent>.+)" "(?P<forwarded_for>.*)"')
if err != null {
    log((err + "(error parsing regex; message: '" + .message + "')") ?? "null", level: "error")
    structured = {"type": "error"}
} else {
  geoip, err = get_enrichment_table_record("gip", { "ip": structured.client}, ["country_code","latitude","longitude"] )
  if err == null {
    if is_array(geoip){
      geoip = geoip[0]
    }
    if geoip != null{
      structured.geoip = geoip
    }
  } else {
    log(err, "error")
  }
}
. = merge(., structured)
"""

# Finally we ship to loki!
[sinks.loki]
type = "loki"
inputs = ["docker", "nginx_logs"]
endpoint = "http://loki.ack.gg:3100"
compression = "snappy"
  [sinks.loki.labels]
  job = "nginx_reverse_proxy"
  http_method = "{{ method }}"
  http_status = "{{ status }}"
  file = "{{ file }}"
  [sinks.loki.encoding]
  codec = "json"
That’s it! We’re now enriching our Nginx logs with location data!
Grafana configuration
Create a new Grafana graph, set Loki as the source and use this query (edit it as you like or need): {source="file", job="nginx_reverse_proxy"} != "geoip\":null" | json lat="geoip.latitude", long="geoip.longitude" | lat != ""
Then, in the Transform tab:
- Extract fields
- Source:
labels - Format:
JSON
- Source:
- Convert field type
- Field:
lat, as:Numeric - Field:
long, as:Numeric
- Field:

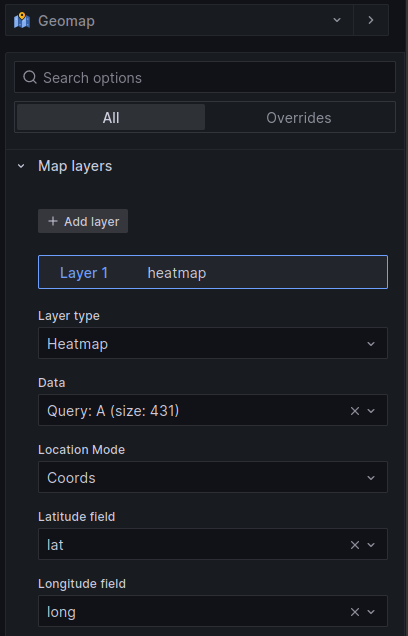
Continue selecting the Geomap graph from the many available
Finally, set up the heatmap
- Map layers -> Layer type: Heatmap
- Map layers -> Location Mode: Coords
- Map layers -> Latitude/Longitude field: lat/long
And there you have it! A beautiful heatmap!